
111 Key CRO Statistics for 2026: Boost Conversions with Our Insights

CRO statistics reveal a growing gap between average websites and top performers. While most sites convert just 2-3% of visitors, optimized experiences convert 4-5× more from the same traffic. With acquisition costs rising and attention shrinking, conversion efficiency is now a core growth lever.
Curated by our B2B SEO agency team — the same expertise behind our ecommerce SEO work.
This report breaks down the latest CRO statistics, covering benchmarks, funnel drop-off, UX and speed, personalization, A/B testing, and AI-driven optimization, so you can see where conversions are actually gained or lost.
It’s built for teams responsible for results: marketers, founders, product, and CRO leads who need clear, data-backed direction.
We keep things up to date with fresh data every quarter. This is the Q1 2026 edition.
Key CRO Statistics in 2026
- Average website conversion rates still sit around 2-3%, meaning over 95% of visitors don’t convert on a typical site.
- Top-performing websites convert at 10-11%+, showing a 4-5× gap between average and optimized experiences.
- Desktop traffic converts up to 2× as well as mobile, even though mobile now drives the majority of visits.
- 45-50% of website visits bounce after a single page, eliminating any chance for conversion before CRO tactics even apply.
- 70% of ecommerce carts are abandoned globally, with mobile abandonment exceeding 80%.
- 68% of users abandon forms before completing them, making mid-funnel friction one of the biggest conversion leaks.
- Personalized CTAs convert 200% better than generic ones, and tailored landing pages can lift conversion rates from 2.4% to 11%+.
- Pages that load in 1 second convert 2.5-3× better than those loading in 5 seconds.
- 77% of companies now run A/B tests, but only 59% test email, leaving major CRO gains untapped.
- AI-powered CRO tools deliver 15-25% conversion lifts, and users who engage with AI chat convert up to 4× more often.
What’s CRO & Why Does It Matter in 2026?
Here’s a simple CRO definition for you:
Conversion Rate Optimization (CRO) is the practice of improving how effectively a website turns visitors into actions: sign-ups, purchases, demo requests, or leads. It focuses on removing friction, clarifying intent, and aligning pages with how users actually make decisions.
CRO matters more in 2026 because growth is harder to buy and easier to lose:
- Paid traffic costs are higher,
- Privacy changes limit tracking and attribution,
- AI-driven competitors can replicate content faster,
- Search results are more crowded than ever.
When traffic is expensive and attention is short, improving conversions is often the fastest way to increase revenue without increasing spend.
General Conversion Rate Optimization Statistics
These benchmarks show how conversion rates vary across channels and formats. They provide a baseline for what “average” performance looks like today:
- Websites (overall): Meta-analyses show that many business websites convert at 2-4%, with 3-3.5% often cited as a realistic global benchmark once low-intent traffic is factored in. (Source)
- PPC landing pages: Paid-traffic landing pages usually convert around 2-4%, while the top decile exceeds 10-11%, highlighting how strongly focused optimization impacts results. (Source)
- Ecommerce: Global ecommerce averages converge around 2.5-3.0% for established stores. Broader datasets that include smaller or newer sites still report lower averages closer to 1.9-2.5%. (Source)
- Blogs: Direct purchase conversions are often under 1%, but newsletter sign-ups and lead-gen actions commonly reach 3-5% on well-optimized blogs, making content a reliable mid-funnel channel. (Source)
- Email: Recent benchmarks show average email click-through rates around 2.0%, with most industries falling in the 1-3% range, reinforcing email’s role as a high-intent outbound channel. (Source)
Mobile vs. desktop
- Desktop traffic consistently converts at a higher rate than mobile traffic. Across ecommerce and lead-gen sites, desktop conversion rates are often up to 2× higher, even though mobile drives more total visits. (Source)
Time-based trend
- From 2020 through 2026, global website conversion rates have remained relatively stable, fluctuating within a narrow range of 1.9-2.4% rather than showing sustained growth. (Source)
Note: These figures don’t represent targets. They represent starting points. Performance gaps between average and top results are usually driven by page clarity, intent alignment, and post-click experience.
What is a Good Conversion Rate?
A “good” conversion rate depends on what action you’re measuring and the intent of the traffic behind it. Conversion rate shows how often visitors complete a desired action after landing on your site or ad, making it one of the clearest signals of how well your messaging and experience align with user intent.
What matters more than chasing a single number is understanding where your performance sits relative to real benchmarks (Source 1, Source 2):
- Underperforming Sites: Roughly 20-30% of websites convert under 1%, showing how common weak funnels still are, even in 2025.
- Median/typical Conversion Rate: Cross-industry datasets cluster around 2.3-2.9%, with 2.5% often used as a practical global baseline.
- Top 25% of Accounts: Sites in the upper quartile commonly convert at 4-5%+, where consistent CRO and clearer intent targeting start to compound.
- Top 10% of Advertisers: The top decile of Google Ads programs frequently achieves 10%+ conversion rates, especially in high-intent service and B2B categories.
- Average Website Conversion Rate: Recent benchmarks place the overall cross-industry average between 2.3-3.0%, depending on traffic mix and methodology.
- Best-performing Websites: Sites in the 90th percentile convert at 11% or higher, typically driven by strong intent matching, mature traffic sources, and refined UX.
The takeaway is simple: “good” is relative. A rate that’s average for one site may be excellent for another. CRO focuses on moving from the crowded middle toward the top quartile, where small gains translate into meaningful revenue growth.
Average Conversion Rate Benchmarks
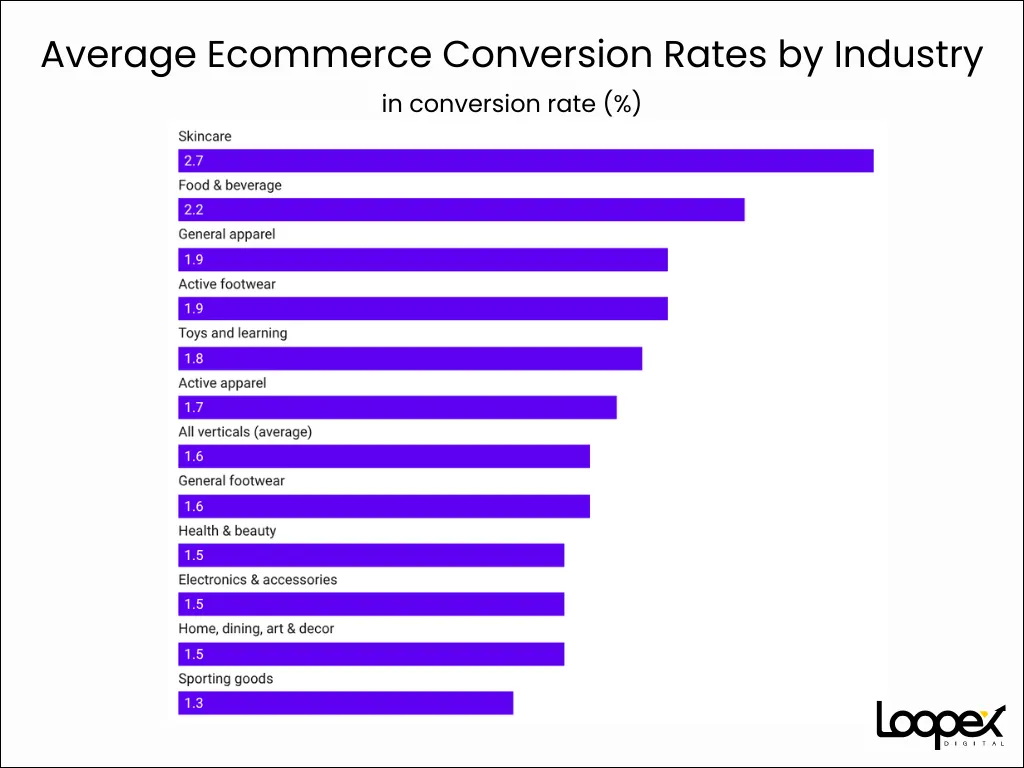
Average Conversion Rate by Industry
Across 14 tracked industries, conversion rates typically range from 2.9% to 3.2% (Source 1, Source 2). Higher-ticket products tend to sit below this range, while simpler, lower-cost offers often convert above it.
- Ecommerce (Global): Most 2025 benchmarks place global ecommerce conversion rates between 1.7% and 3.0%, with 2% often used as a practical reference point (Source).
- B2B vs B2C: B2B ecommerce and SaaS sites commonly convert at 2% or lower, while finance and professional services more often hit 3%+ on lead-generation actions (Source).
Food & beverage remains one of the stronger ecommerce categories, with average conversion rates around 2.2%, well above the global ecommerce average and only below skincare (Source).
Average Conversion Rate by Country
Country-level averages reflect differences in market maturity, trust, logistics, and purchasing behavior.
Many established ecommerce markets cluster around 1.8-2.2%, with top-performing countries slightly above 2% (Source).
Leading countries are as follows (Source):
- Germany: 2.2%
- The United States: 2.0%
- The United Kingdom: 1.9%
- Denmark: 1.8%
- The Netherlands: 1.8%
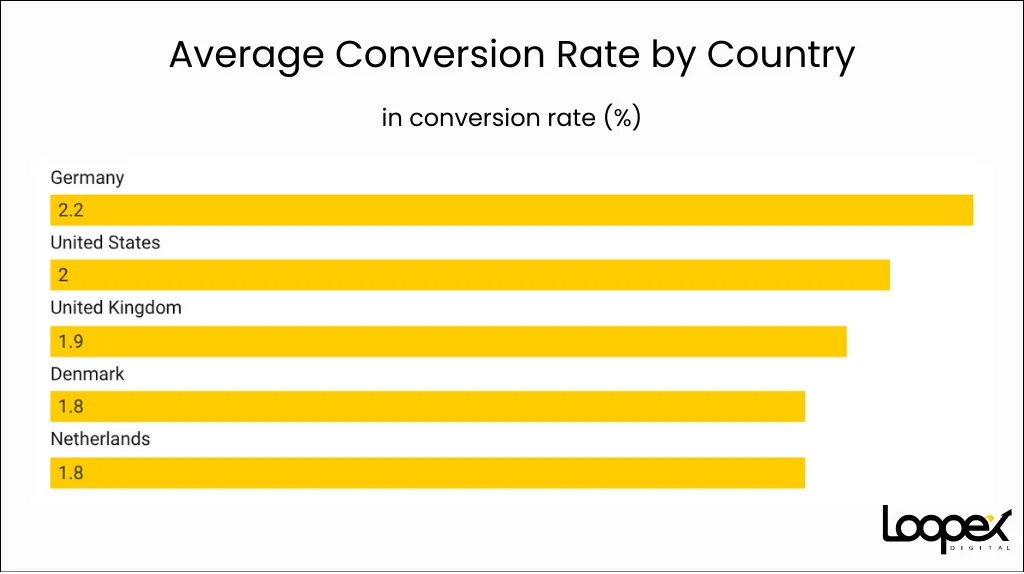
Note: There are seasonal lifts. Q4 data shows temporary spikes, with UK ecommerce conversion rates reaching 3.1% during peak holiday periods.
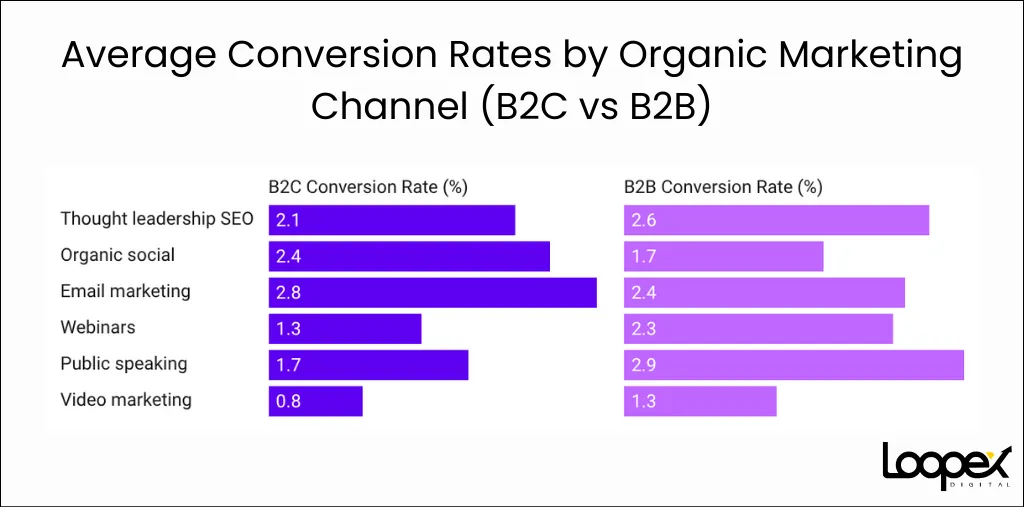
Average Conversion Rate by Channel / Source
Conversion performance varies sharply by channel and by audience (Source):
Organic Channels:
- Thought leadership SEO: 2.1% (B2C); 2.6% (B2B)
- Organic Social: 2.4% (B2C); 1.7% (B2B)
- Email Marketing: 2.8% (B2C); 2.4% (B2B)
- Webinars: 1.3% (B2C); 2.3% (B2B)
- Public Speaking: 1.7% (B2C); 2.9% (B2B)
- Video Marketing: 0.8% (B2C); 1.3% (B2B)
Paid & Outbound Channels:
- PPC / SEM: 1.2% (B2C); 1.5% (B2B)
- Paid Social: 2.1% (B2C); 0.9% (B2B)
- PR: 0.4% (B2C); 0.3% (B2B)
- Trade Shows: 0.4% (B2C); 0.7% (B2B)
- Outdoor Advertising: 0.4% (B2C); 0.6% (B2B)
- Direct Mail: <0.1% (B2C); 0.3% (B2B)
- Account-Based Marketing (ABM): N/A (B2C); 3.8% (B2B)
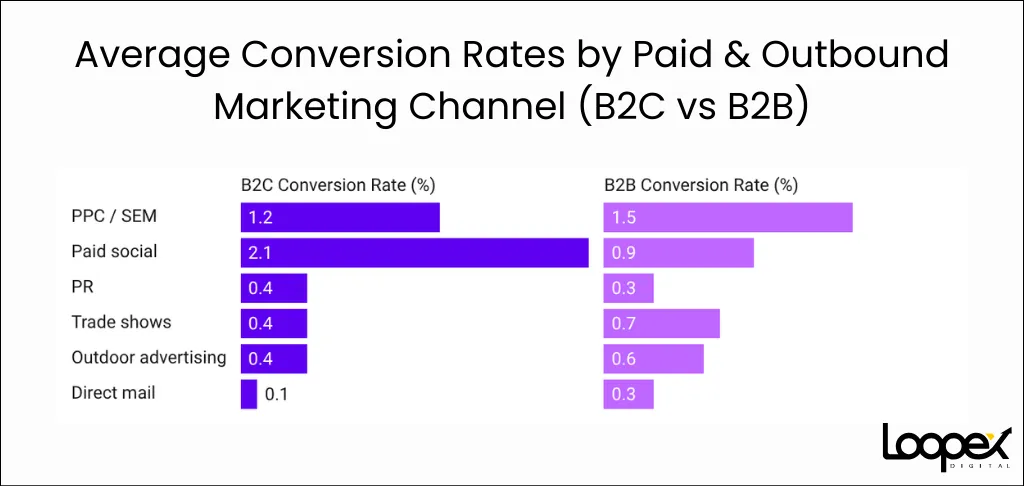
Takeaway: High-intent channels consistently outperform broad reach tactics.
Average Conversion Rate by Device
Think of these as broad CRO baselines across most websites (Source 1, Source 2).
- Desktop: Usually converts the best, landing around 4% on average.
- Mobile: Typically converts 1-2 points lower than desktop, often in the 2-3% range, even though it drives most visits.
- Tablet: Smaller traffic share, but conversion rates are often similar to or slightly higher than desktop (around 2.5-3%+).
At a high level, the pattern remains consistent: desktop and tablet traffic convert better than mobile traffic, even as mobile traffic continues to grow.
Average Conversion Rate by Platform
Platform data is less clean, but the trend is clear (Source):
- Desktop OS (Windows, macOS): Generally see higher conversion rates, especially for longer or more complex actions.
- Mobile OS (iOS, Android): Mobile traffic converts lower overall, though iOS often edges out Android on conversion and spend in many markets.
For CRO, the takeaway is simple: device and platform still shape outcomes, and mobile experience gaps continue to matter.
CRO Adoption Statistics
CRO is no longer a niche practice. For most teams, testing is now part of standard marketing operations, even if maturity still varies by channel.
- 77% of companies run A/B tests on their websites, showing that experimentation is now the norm rather than an exception (Source).
- Only 1% of companies report no use of A/B testing or plans to adopt it, making full non-adoption increasingly rare among mid-size and enterprise teams (Source).
- 71% of active testers run two or more tests per month, signaling a shift from one-off experiments to ongoing optimization programs (Source).
- Channel maturity still lags in some areas: while website testing is common, only 59% of companies A/B test email campaigns, leaving a large share of email performance untested (Source).
Overall, most organizations practice CRO, but many still apply it unevenly across channels.
How Much Marketers Spend on CRO
CRO spending continues to grow as traffic gets more expensive and harder to measure.
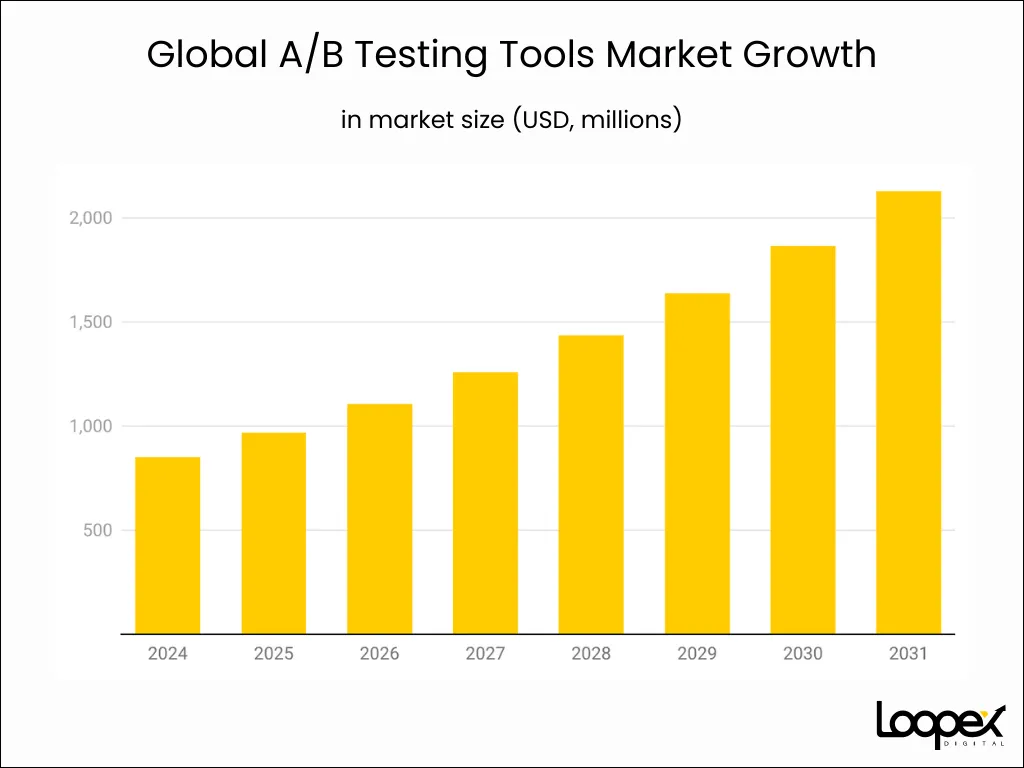
- The global A/B testing tools market reached $969M in 2025 and is projected to grow at 14% CAGR through 2031, reflecting sustained investment in experimentation platforms (Source).
- Revenue-focused testing programs improve conversion performance by up to 40% while cutting wasted marketing spend by 50%, positioning CRO as a cost-efficiency lever (Source).
- Companies investing consistently in CRO tooling often report double- or triple-digit ROI, with case studies showing 25-49% conversion lifts when testing is systematic and ongoing (Source).
The pattern is clear: CRO budgets aren’t shrinking in response to AI or privacy shifts. Teams are prioritizing conversion efficiency over chasing more traffic.
Conversion Funnel CRO Stats + Bounce
CRO doesn’t live at the checkout button. Most losses happen much earlier, before users ever reach a decision point.
Top-of-funnel drop-off is immediate:
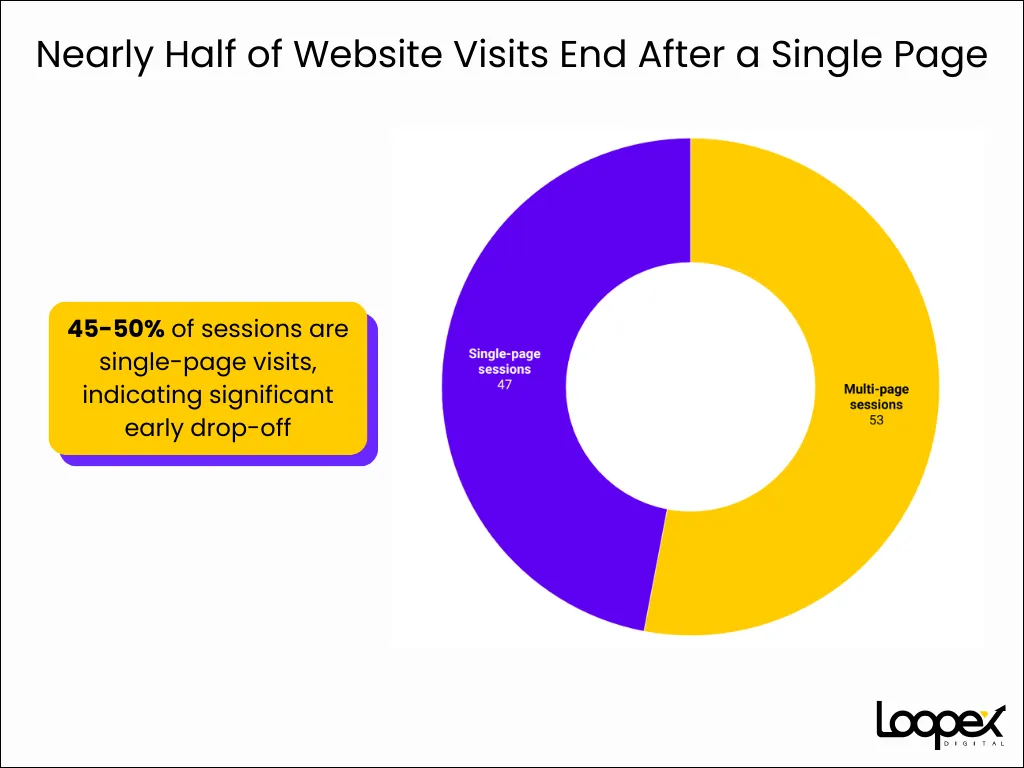
- 45-50% of visits are single-page sessions, meaning nearly half of users leave without interacting beyond the first page.
- Once page load time crosses 3 seconds, bounce probability jumps, cutting engagement before a CTA even appears.
The middle of the funnel leaks the most (Source):
- 68% of users abandon forms before finishing them, making forms one of the biggest friction points.
- Across large datasets, only 16.5% of users who start a form complete it, exposing a wide gap between intent and follow-through.
High intent doesn’t guarantee conversion (Source 1, Source 2):
- 70% of shopping carts are abandoned globally, so only about 3 out of 10 carts turn into purchases.
- On mobile, abandonment climbs past 80%, compared to roughly 70-73% on desktop.
- 40% of shoppers drop out at checkout due to unexpected costs such as shipping, fees, or taxes.
The funnel doesn’t end at purchase:
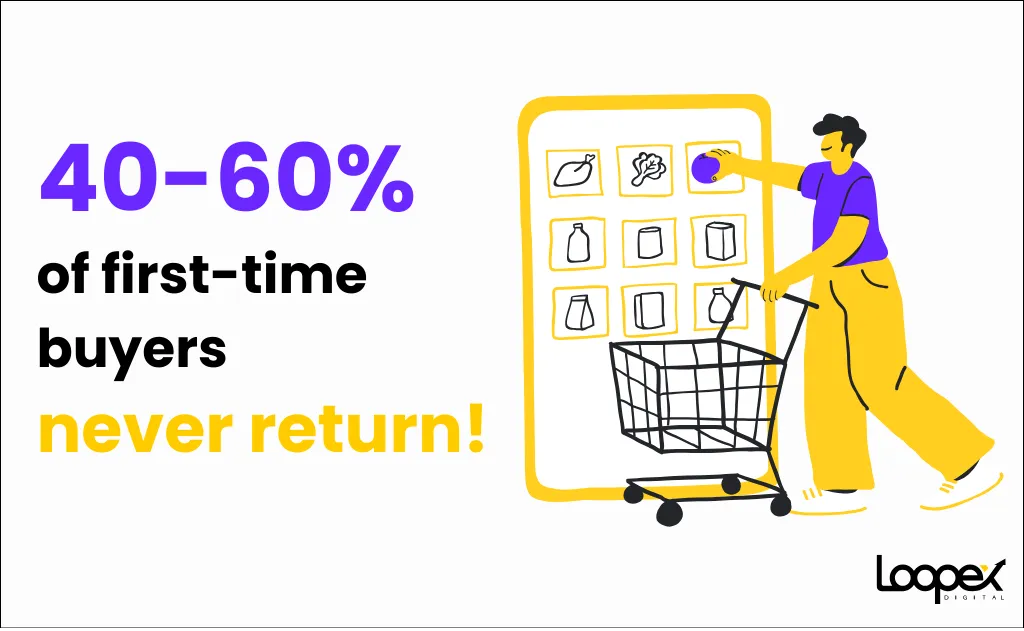
- 40-60% of first-time buyers never return, turning many conversions into one-off wins instead of long-term value.
Why micro-conversions matter:
- Final purchase rates often sit around 2-3%, while intermediate actions: email signups, add-to-cart clicks, form starts, frequently reach 5-20%+ (Source). That gap explains where most opportunity lives: between interest and commitment.
What this shows: Only a small single-digit share of visitors who enter the funnel ever convert. Most losses happen well before checkout, not at the payment step, making early and mid-funnel optimization the highest-impact CRO work.
UX, Speed & Mobile CRO Statistics
User experience and speed shape conversion outcomes long before users read a headline or click a button.
- Users form an opinion of a website in 0.05 seconds, making visual clarity critical at first glance.
- 94% of first impressions are design-related, not content-related.
- 38% of users stop engaging with a site if the design feels poor or unattractive.
- A 1-second delay in page load can reduce conversions by 7% (Source).
- Improving UX design by just 5% can increase customer retention by 25%, boosting profits (Source).
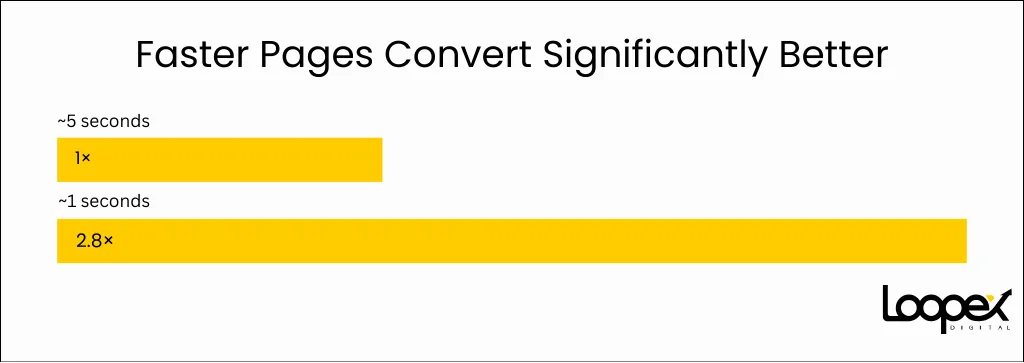
- Pages that load in 1 second convert 2.5-3× better than those that load in 5 seconds (Source).
- On mobile, 53% of users leave if the load time exceeds 3 seconds (Source).
- 88% of users are less likely to return after a poor user experience (Source).
The pattern is consistent: faster pages and cleaner UX convert better, especially on mobile, where delays compound into a steep drop-off.
Personalization & Conversion Rate Statistics
- Personalized CTAs convert 202% better than generic CTAs.
- CTAs tailored to user context convert 42% more visitors into leads than untargeted CTAs.
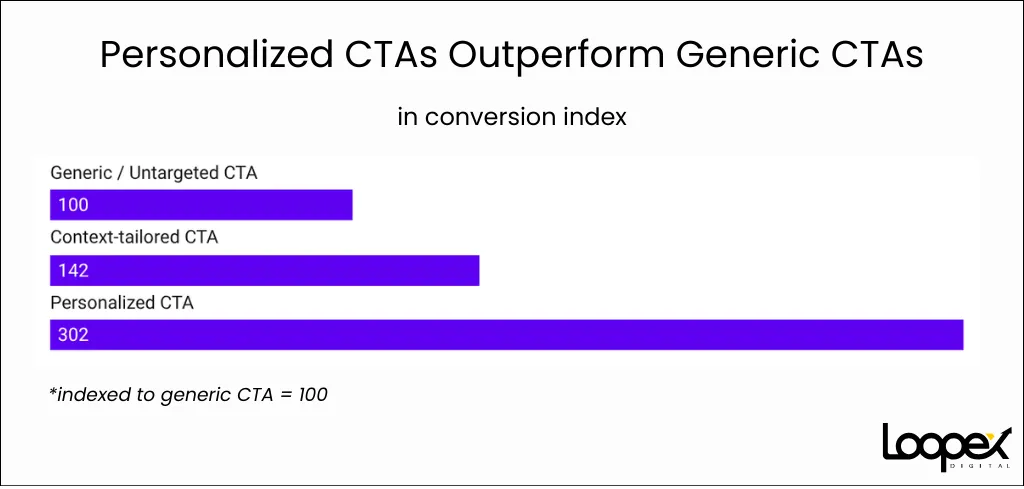
- Well-matched, high-intent landing pages can lift conversion rates from 2.4% to 11.5%+.
- Dynamic, context-matched landing pages deliver double-digit conversion uplifts compared to static pages (Source).
- Dynamic message personalization delivers 27% conversion uplifts in A/B tests.
- Personalized recommendations and widgets account for 25-35% of total revenue and generate 2-5× higher click-through rates than static content (Source).
- AI-driven email personalization produces 41% more revenue and 13% higher click-through rates than non-personalized campaigns (Source).
- Companies leading in advanced personalization generate 40% more revenue from personalization initiatives, with 5-15% overall revenue lifts (Source).
- 92% of businesses use AI-driven personalization, and 57% increased AI investment in personalization in the past year (Source).
Content, UGC & Social Proof Statistics
Your CRO is heavily dependent on content, so let’s see a few stats that show how, starting with UGC (Source):
- The overall conversion rate for e-commerce UGC page visitors is 3.2%.
- The conversion rate from UGC impressions is 3.3%.
- The conversion lift from UGC impressions is 3.8%.
- The conversion rate from UGC interactions is 6.4%.
- The conversion lift from UGC interactions is 102.4%.
And, generally, brands using UGC achieve about 29% higher web conversions than those relying solely on brand‑created content.
If we go deeper into social proof and trust signals in content, this is what we see:
- Adding product reviews increases total conversions by 3%+, and even one review can lift conversions by 10%+ (Source).
- Products with five or more reviews see purchase likelihood increase by up to 270% compared to products with no reviews.
- Strong positive reviews can boost conversion rates by up to 370%, with most studies showing an average lift of 15-20%.
Takeaway from these CRO statistics: Reviews actively drive conversions, especially when they’re visible, credible, and easy to scan.
CTA & Landing Page Optimization Statistics
- Emails with a single, focused CTA generate up to 1,617% more sales than emails with multiple CTAs.
- Social ads with a clear CTA achieve 285% higher click-through rates than ads without explicit calls to action.
- Replacing text links with button-style CTAs increases click-through rates by an average of 45%.
- In email campaigns, CTA buttons outperform text links by 28% in click-through rate.
- On mobile devices, button CTAs can outperform text links by up to 200%, driven by visibility and tapability.
Larger, more prominent CTA buttons increase click-through rates by 90% compared to smaller or low-contrast buttons.
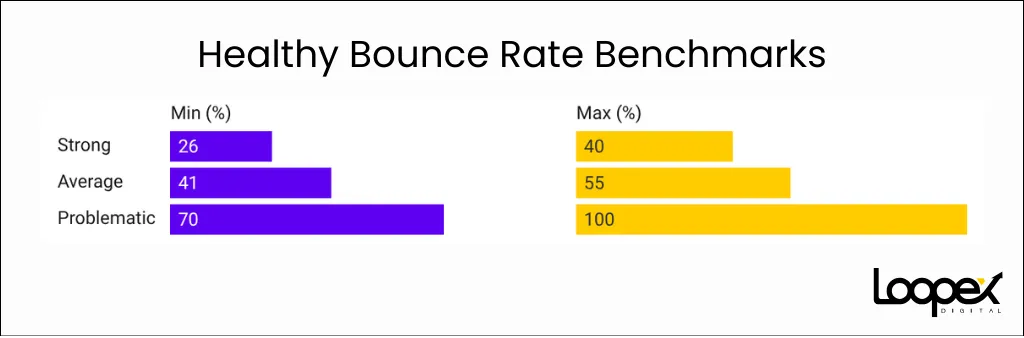
Bounce Rate Statistics
Bounce rate sets the ceiling for conversion. If users leave after one page, nothing else in the funnel gets a chance to work. So, we can’t talk about it when covering CRO statistics.
The global median bounce rate is around 44-45% across industries, meaning roughly half of all visits end in single-page sessions.
Healthy bounce rate ranges for 2025-26 (Source):
- 26-40% = strong
- 41-55% = average
- 70%+ = problematic for most multi-page or transactional sites.
Here are some more data on bounce rates affecting CRO:
- By site type, ecommerce and marketplace sites average 38-39%, while content-heavy blogs and informational sites often range from 65% up to 90% (Source).
- When load time increases from 1 to 3 seconds, bounce probability rises by 32%. At 5 seconds, it jumps by 90%. (Source)
- A 1-second Largest Contentful Paint (LCP) improvement has been linked to a 14-point drop in bounce rate and a 13% lift in conversions, underscoring the close tie between bounce and conversion (Source).
Lower bounce doesn’t guarantee higher conversions, but high bounce almost always caps them.
AI and CRO Statistics
- Companies using AI-powered CRO tools report average conversion rate increases of 15-25%, with some platforms citing 20-30% uplifts over non-AI-optimized controls (Source).
- AI-driven marketing strategies are associated with 20% higher conversion rates, on average, than traditional, non-AI approaches.
- In 2025, 30% of companies used AI to improve testing and experimentation, up from roughly 5% in 2021, indicating rapid adoption of AI in CRO workflows.
- AI chatbots increase overall conversion rates by 23% on average, with ecommerce implementations reporting up to 30% conversion improvements.
- Users who engage with AI-assisted chat or guidance tools convert up to 4× more often than those who do not.
- Organizations deploying AI chatbots frequently report strong returns, with benchmarks showing that they generate $8 in revenue for every $1 invested in chatbot technology (Source).
Methodology
This guide pulls together data from CRO tools, analytics platforms, industry surveys, and large-scale performance studies covering ecommerce, B2B, and lead-gen websites.
We focused on recent data from 2025-2026 and cross-checked similar benchmarks to avoid relying on outdated or one-off numbers.
Conversion rates naturally vary by industry, traffic intent, device mix, and site type, so treat these figures as practical reference points.
Conclusion
Use these statistics as direction, not targets. Average benchmarks show what’s common, but the real gains come from closing the gaps in your own funnel.
In 2026, CRO is less about chasing more traffic and more about making existing traffic work harder. Speed, UX, trust signals, and intent alignment consistently separate average sites from top performers.
The teams winning are testing, measuring, and improving where users actually drop off, and letting the data guide what to fix next. If you need help with your CRO, you can trust our team, which has generated more than $972M in revenue for its clients. So, contact us and let’s get your CRO to the max.
FAQs
What is a good conversion rate in 2026?
For most websites, 2-3% is typical. Hitting 4-5%+ usually means CRO is working well. Top performers often exceed 10%, depending on industry and intent.
Does CRO still matter with AI?
Yes, arguably more than ever. AI can help drive traffic and content, but CRO is what turns that traffic into revenue.
How long does CRO take to work?
You can see early wins in weeks, but consistent results come from ongoing testing over 2-3 months or more.
Is CRO better than paid ads?
They work best together. CRO improves the results of every channel, while paid ads increase volume. CRO makes ad spend more efficient.
What industries benefit most from CRO?
Ecommerce, SaaS, finance, lead-gen services, and B2B companies see the biggest gains, especially where traffic is expensive or decision-making is complex.
References
- ABralytics. How Website Performance Affects Conversions. Accessed on January 26, 2026.
https://abralytics.com/how-website-performance-affects-conversions/ - Amra & Elma. AI Chatbot Conversion Rate Statistics. Accessed on January 26, 2026.
https://www.amraandelma.com/ai-chatbot-conversion-rate-statistics/ - Amra & Elma. Multi-Step Form Abandonment Statistics. Accessed on January 26, 2026.
https://www.amraandelma.com/multi-step-form-abandonment-stats/ - Amra & Elma. Operating System Marketing Statistics. Accessed on January 26, 2026.
https://www.amraandelma.com/operating-system-marketing-statistics/ - Analyzify. Cart Abandonment Statistics. Accessed on January 26, 2026.
https://analyzify.com/statsup/cart-abandonment - Archive. User-Generated Content Overview. Accessed on January 26, 2026.
https://archive.com/blog/user-generated-content - Ascend2. A/B Testing in Marketing Research. Accessed on January 26, 2026.
https://ascend2.com/wp-content/uploads/2025/06/AB-Testing-in-Marketing-Research-Ascend2-250611.pdf - Beacon Webworks. Website First Impression Statistics (2025 Update). Accessed on January 26, 2026.
https://beaconwebworks.com/27-website-first-impression-statistics-2025-update - Calconic. Average Bounce Rate. Accessed on January 26, 2026.
https://www.calconic.com/blog/average-bounce-rate - Capital One Shopping. Online Reviews Statistics. Accessed on January 26, 2026.
https://capitaloneshopping.com/research/online-reviews-statistics/ - CausalFunnel. Average Bounce Rate by Industry (2025 Benchmarks). Accessed on January 26, 2026.
https://www.causalfunnel.com/blog/average-bounce-rate-by-industry-2025-benchmarks/ - Chatbot Marketing. CTA Button vs Text: What Gets More Clicks? Accessed on January 26, 2026.
https://chatbotmarketing.com.au/cta-button-vs-text-what-gets-more-clicks/ - CleverTap. Average Website Conversion Rate Benchmarks. Accessed on January 26, 2026.
https://clevertap.com/blog/average-website-conversion-rate-benchmarks/ - Databox. Content Marketing Benchmarks by Industry. Accessed on January 26, 2026.
https://databox.com/content-marketing-benchmarks-by-industry - Digital Web Solutions. Average Bounce Rate by Industry. Accessed on January 26, 2026.
https://digitalwebsolutions.com/blog/average-bounce-rate-by-industry/ - Fera. Online Product Review Statistics for Ecommerce Stores. Accessed on January 26, 2026.
https://fera.ai/blog/posts/online-product-review-statistics-ecommerce-stores-need-them - First Page Sage. Conversion Rate by Marketing Channel. Accessed on January 26, 2026.
https://firstpagesage.com/reports/conversion-rate-by-channel/ - Gartner. Beyond ChatGPT: The Future of Generative AI for Enterprises. Accessed on January 26, 2026.
https://www.gartner.com/en/articles/beyond-chatgpt-the-future-of-generative-ai-for-enterprises - GoCardless. Mobile vs Desktop Conversion Rates. Accessed on January 26, 2026.
https://gocardless.com/guides/posts/mobile-vs-desktop-conversion-rates/ - GreetNow. Website Conversion Rate Statistics. Accessed on January 26, 2026.
https://greetnow.com/blog/website-conversion-rate-statistics - Growth-onomics. Email Marketing Benchmarks 2026: Open Rates and CTRs. Accessed on January 26, 2026.
https://growth-onomics.com/email-marketing-benchmarks-2026-open-rates-ctrs/ - Harvard Business School Working Knowledge. The Economics of E-Loyalty. Accessed on January 26, 2026.
https://hbswk.hbs.edu/archive/the-economics-of-e-loyalty - Huckabuy. Page Speed, Bounce Rate, and Conversion Rate Statistics. Accessed on January 26, 2026.
https://huckabuy.com/20-important-page-speed-bounce-rate-and-conversion-rate-statistics/ - Humanic AI. AI for Email Marketing Statistics (2024–2025). Accessed on January 26, 2026.
https://humanic.ai/blog/32-ai-for-email-marketing-statistics-2024-2025-data-every-marketer-needs - Instapage. Personalization Statistics. Accessed on January 26, 2026.
https://instapage.com/blog/personalization-statistics - Kanuka Digital. Website Load Time Statistics in 2025. Accessed on January 26, 2026.
https://www.kanukadigital.com/2025/09/website-load-time-statistics-in-2025/ - Landingi. Conversion Rate Optimization with AI. Accessed on January 26, 2026.
https://landingi.com/blog/conversion-rate-optimization-with-ai/ - Landmark Global. Conversion Rates: Key Influencing Factors. Accessed on January 26, 2026.
https://landmarkglobal.com/eu/en/news-insights/conversion-rates-factors/ - LeadHero. How AI Chatbots Boost Lead Conversion Rates. Accessed on January 26, 2026.
https://leadhero.ai/how-ai-chatbots-boost-lead-conversion-rates/ - Loopex Digital. Web Design Statistics. Accessed on January 26, 2026.
https://www.loopexdigital.com/blog/web-design-statistics - Lucky Orange. What Is a Good Conversion Rate? Accessed on January 26, 2026.
https://www.luckyorange.com/blog/posts/good-conversion-rate - Mailmend. A/B Testing Email Statistics. Accessed on January 26, 2026.
https://mailmend.io/blogs/ab-testing-email-statistics - Marketing LTB. Conversion Rate Optimization (CRO) Statistics. Accessed on January 26, 2026.
https://marketingltb.com/blog/statistics/conversion-rate-optimization-cro-statistics/ - Marketing LTB. Personalization Statistics. Accessed on January 26, 2026.
https://marketingltb.com/blog/statistics/personalization-statistics/ - Martal Group. CTA Best Practices. Accessed on January 26, 2026.
https://martal.ca/cta-best-practices-lb/ - MediaCharge. Leading Brands Win with A/B Testing: Optimizing Web Conversion Rates. Accessed on January 26, 2026.
https://mediacharge.com/publications/leading-brands-win-with-a-b-testing-optimizing-web-conversion-rates - Nudge Now. Dynamic Content Personalization: Insights and Techniques. Accessed on January 26, 2026.
https://www.nudgenow.com/blogs-copy/dynamic-content-personalization-insights-techniques - Pimms. Best A/B Testing Tools (2025 Edition). Accessed on January 26, 2026.
https://pimms.io/blog/best-ab-testing-tools-2025-edition - Red Stag Fulfillment. Average Conversion Rate for Ecommerce. Accessed on January 26, 2026.
https://redstagfulfillment.com/average-conversion-rate-for-ecommerce/ - Red Stag Fulfillment. Percentage of Online Shoppers Who Abandon Their Cart. Accessed on January 26, 2026.
https://redstagfulfillment.com/percentage-of-online-shoppers-abandon-their-cart/ - Roast My Web. Average Website Conversion Rate by Industry. Accessed on January 26, 2026.
https://www.roastmyweb.com/blog/average-website-conversion-rate-by-industry - Ruler Analytics. Conversion Rate by Industry. Accessed on January 26, 2026.
https://www.ruleranalytics.com/blog/insight/conversion-rate-by-industry/ - Sender. Call-to-Action Statistics. Accessed on January 26, 2026.
https://www.sender.net/blog/call-to-action-statistics/ - Shapo. Google Review Statistics. Accessed on January 26, 2026.
https://shapo.io/blog/google-review-statistics/ - Smart Insights. Ecommerce Conversion Rates. Accessed on January 26, 2026.
https://www.smartinsights.com/ecommerce/ecommerce-analytics/ecommerce-conversion-rates/ - Sopro. AI Sales and Marketing Statistics. Accessed on January 26, 2026.
https://sopro.io/resources/blog/ai-sales-and-marketing-statistics/ - SQ Magazine. Mobile vs Desktop Statistics. Accessed on January 26, 2026.
https://sqmagazine.co.uk/mobile-vs-desktop-statistics/ - Statista. Global Conversion Rate by Industry and Device. Accessed on January 26, 2026.
https://www.statista.com/statistics/1106713/global-conversion-rate-by-industry-and-device/ - Statista. Online Shopper Conversion Rate Worldwide. Accessed on January 26, 2026.
https://www.statista.com/statistics/439576/online-shopper-conversion-rate-worldwide/ - SuperAGI. Top AI Conversion Rate Optimization Platforms in 2025. Accessed on January 26, 2026.
https://superagi.com/top-10-ai-conversion-rate-optimization-platforms-in-2025-a-comprehensive-guide-7/ - Sweor. First Impressions Statistics. Accessed on January 26, 2026.
https://www.sweor.com/firstimpressions - Textedly. Online Review Statistics for 2025. Accessed on January 26, 2026.
https://www.textedly.com/blog/online-review-statistics-for-2025-to-know - VWO. A/B Testing Statistics. Accessed on January 26, 2026.
https://vwo.com/blog/ab-testing-statistics/ - WeDevs. Ecommerce Conversion Rate Statistics. Accessed on January 26, 2026.
https://wedevs.com/blog/397653/ecommerce-conversion-rate-statistics/ - Website Speedy. Why 53% of Mobile Users Abandon Sites That Take Over 3 Seconds to Load. Accessed on January 26, 2026.
https://websitespeedy.com/blog/why-53-of-mobile-users-abandon-sites-that-take-over-3-seconds-to-load/ - WordStream. Conversion Rate Optimization Statistics. Accessed on January 26, 2026.
https://www.wordstream.com/blog/conversion-rate-optimization-statistics/ - WP Rocket. Website Load Time and Speed Statistics. Accessed on January 26, 2026.
https://wp-rocket.me/blog/website-load-time-speed-statistics/
Maria Harutyunyan is the Co-founder and Head of SEO at Loopex Digital, where she leads SEO strategy for SaaS, e-commerce, and B2B brands. With 10+ years in search, she specializes in link building and digital PR, earning editorial backlinks from MSN, Business Insider, Android Authority, and 30+ other major publications. She has been featured in Forbes, quoted as an SEO expert on Shopify, and writes for Convince & Convert, SE Ranking, and Mangools (KWFinder). She is also the founder of Armenia's first SEO Academy, having trained 500+ marketers.
Submit the form - Get Free Proposal
24 hours
Don’t forget to share this post!
Latest Articles


Submit the form - Get Free Proposal
24 hours

