
60 Web Design Statistics for 2026: UX, Mobile, CRO, AI Trends

Even according to the oldest benchmarks, it takes about 0.05 seconds for a visitor to form an opinion after landing on your site. Web design is the most essential element that shapes the first impression, combining UI/UX, visual appeal, speed, and credibility.
Maintained by Loopex Digital — we apply these principles in our technical SEO engagements.
In 2026, this matters more than ever. AI-built sites are everywhere, expectations are higher, and performance standards are stricter. Poor speed, weak mobile UX, and missing trust signals now directly hurt visibility and conversions.
Let’s review the key Web Design Statistics for 2026 to help web designers, marketers, founders, and growth teams understand what drives engagement, trust, and results, backed by real data.
We keep things up to date with fresh data every quarter. This is the Q1 2026 edition.
Key Web Design Statistics
- 94% of first impressions are design-related.
- 75% of a website’s credibility is influenced by its design.
- Only 47% of sites meet Google’s Core Web Vitals thresholds.
- 58-60% of global web traffic is mobile, driving 78% of retail traffic.
- Mobile cart abandonment reaches 85.65% due to UX and performance issues.
- AI-driven traffic converts at 14.2%, compared to 2.8% from traditional search.
The Importance of Web Design in 2026
Web design directly shapes how users judge a brand, and this has been true even before 2026. But nowadays, things are more serious: a modern website is no longer just a visual asset. It’s a performance and credibility tool that affects how users navigate, how long they stay, and whether they take action.
So, design decisions now go beyond appearance. UX, accessibility standards, loading speed, and personalization features all play a role in how effectively a site supports business goals.
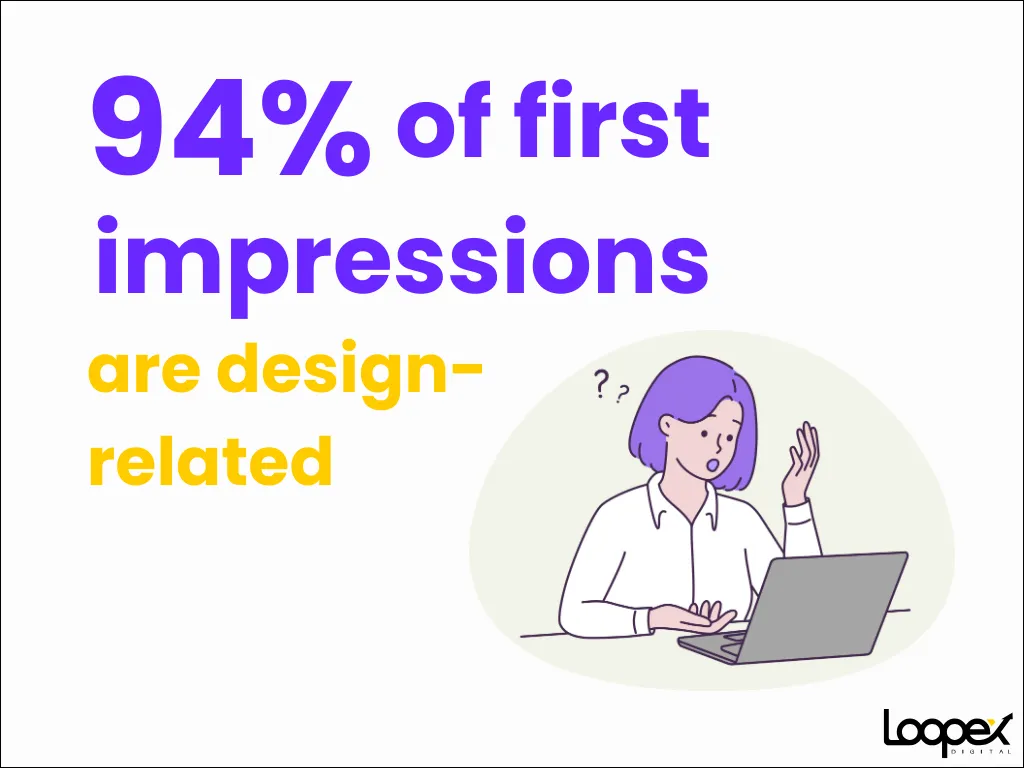
- 94% of first impressions are design-related.
- 75% of a website’s credibility is influenced by its design.
- Well-executed UI can increase conversion rates by up to 200%, while UX can boost it by more than 400% (Source).
Search engines also factor in design-related performance signals, such as fast load times, accessibility compliance, and smooth interactions, which now affect visibility and rankings (Source).
User expectations have shifted: people want secure browsing, clear privacy practices, and inclusive design that works across devices and abilities. We’ll share data about this later in the guide.
What this means for you in practice:
- Design directly affects trust and credibility
- Usability influences conversion rates
- Performance impacts search visibility
- Accessibility is no longer optional.
Web Design Industry Statistics
The web design industry continues to grow as more businesses invest in better digital experiences, mobile-first platforms, and conversion-focused UX.
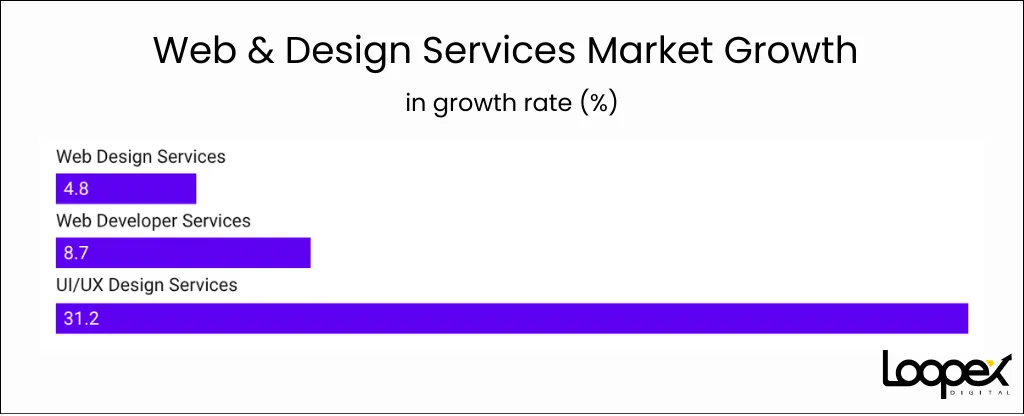
- The global web developer services market is expected to reach $135.9B by 2032, growing at 8.7% CAGR (Source).
- The broader web design services market is projected to grow at a 4.8% CAGR from 2025 to 2032, driven by rising demand for responsive, UX-driven websites (Source).
- The UI/UX design services market is expected to reach $8.8B in 2026, and $77.18B by 2034 with a 31.2% CAGR (Source).
- SME and enterprise spending is rising as companies invest in stronger online presence, mobile-first platforms, and e-commerce experiences (Source).
- In the Asia-Pacific region, government digitalization programs are increasing demand for professional web and app design services (Source).
- North America holds 45-50% of the UI/UX market, while Asia-Pacific accounts for 25-28% (Source).
In terms of the job market (not the service market), the financial side is still growing:
- The UI/UX market is valued at $2.91B in 2026 with a projected 32.05% CAGR through 2031 (Source).
- The UI design segment is projected to reach $3.21B in 2026 and $9.83B by 2035 (15.01% CAGR) (Source).
- The most in-demand skills include responsive design, accessibility, performance optimization, and mobile-first UX (Source).
General Web Design Statistics
- The number of websites worldwide has skyrocketed to 1.34 billion, up from just 17 million in 2000 (75× more in just 26 years) (Source).
- At least 3 new websites are created every second, with estimates ranging from 252,000 to 1 million per day.
Website User Behaviour Statistics
- 88% of users won’t return after a bad website experience.
- 52% of U.S. shoppers abandon their purchases due to poor UX.
- Better navigation can reduce bounce by 10-15% and increase task success by up to 40% (Source).
- Typical bounce rates in 2026 still range from 41% to 55%, depending on the industry (Source).
Web Accessibility Statistics
- 79% of screen reader users primarily browse on mobile devices.
- 96%+ of websites still fail basic WCAG accessibility checks.
- 94.8% of the top 1M homepages contain detectable accessibility errors.
- 2,014 accessibility lawsuits were filed in the first half of 2025, a 37% YoY increase.
- 22.6% of lawsuits targeted sites that already used accessibility widgets.
- 73% of disabled users face accessibility barriers on over 25% of the sites they visit (Source).
As you see, accessibility gaps remain widespread, even among large brands. Mobile accessibility is now a baseline expectation, not an advanced feature.
Mobile Web Design Statistics
- 58-60% of web traffic is mobile, and smartphones drive 78% of global retail traffic (Source).
- 81% of websites still perform poorly on mobile UX.
- When mobile pages take over 4 seconds to load, 63% of users leave. At 6 seconds, about 66% are gone (Source).
- Each extra second of delay can reduce conversions by around 7%.
- Navigation issues cause 30-40% of mobile usability problems. Users usually leave if they can’t find what they need within 10-15 seconds (Source).
- 49% of users primarily browse with one thumb. Placing key actions in thumb-reach zones improves comfort and accuracy.
- 88% are less likely to return after a poor mobile experience.
SEO & Core Web Vitals Performance Statistics
Web design affects your SEO, and Google still uses Core Web Vitals as ranking signals in 2026, especially when content quality is similar.
- Google defines good Core Web Vitals as LCP ≤ 2.5s, INP ≤ 200ms, and CLS < 0.1. Anything slower counts as poor UX (Source).
- Only 47% of sites currently meet all three thresholds. The rest lose an estimated 8–35% in conversions and revenue due to performance issues (Source).
- Case studies show that cutting 1-1.5s from LCP, 200-300ms from INP, and 0.10-0.15 from CLS can drive 15-25% conversion lifts (Source).
- Top-ranking pages usually load in 1.65 (Source).
- Improving load time from 3s to 1s can cut bounce by 32% and boost organic traffic by 15% (Source).
Ecommerce Web Design Statistics
- Mobile ecommerce converts at around 2.1% on average, but optimized UX and faster load times can push it to 3.3% (Source).
- Mobile cart abandonment sits between 80% and 86%, higher than on desktop, mainly due to usability and performance issues (Source 1, Source 2).
- Overall cart abandonment averages 69.99%, but on mobile it jumps to 85.65% (Source).
- Buggy or glitchy mobile sites can lead to abandonment rates as high as 73.4%.
Conversion-Driven Web Design Statistics (CRO)
CTA & Form Design Statistics
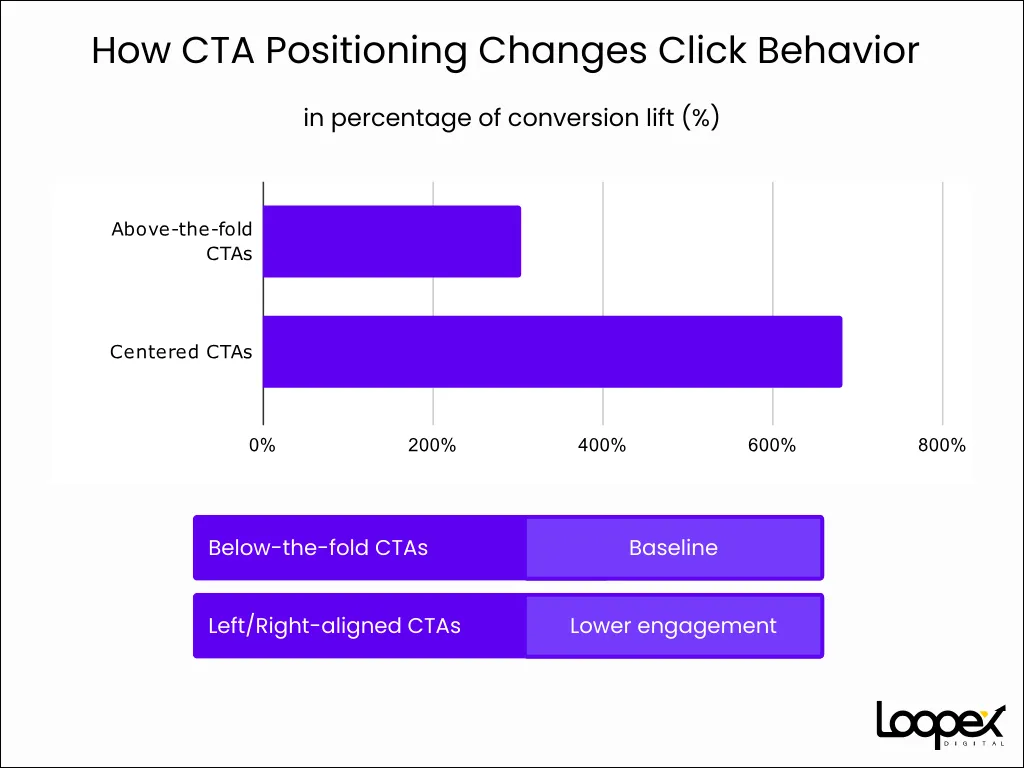
- CTAs placed above the fold perform 304% better than those below it.
- Centered CTAs get up to 682% more clicks than left- or right-aligned buttons.
- Action-focused button copy can lift conversions by 161%.
- Cutting a form from 9 to 5 fields drove a 34% increase in conversion in one case study (Source).
Trust Signals That Increase Conversions
- Security and payment trust badges near checkout can increase conversions by 12–27%.
- Clear pricing, guarantees, and refund policies reduce hesitation and increase form submissions (Source).
Personalization & Dynamic UX Performance
Web Design Trends in 2026
Web design trends that perform well in 2026 are those that change user behavior: more engagement, lower bounce rates, and higher completion rates.
Visual and Interactive Elements
- Subtle micro-animations and scroll-based storytelling increase engagement by about 20%.
- Clear visual hierarchy with guided motion can boost conversions by around 30%.
- Well-placed animations reduce cognitive load and keep users on the page longer (Source).
Minimalism and Clean Design
- Cluttered designs see bounce rates about 50% higher in 2026.
- Minimal, content-first layouts increase viewing time by roughly 59%.
- Simplified navigation can reduce bounce by up to 40%.
AI-Powered User Experiences
- AI-personalized web experiences increase engagement and time on site (Source).
- Behavior-based layouts and recommendations guide users to the next steps (Source).
- AI-powered UX improves click-through and conversion rates by simplifying journeys (Source).
AI’s Impact on Web Design
AI-powered web experiences are changing how users navigate, engage, and convert in 2026.
- 44% of AI search users now prefer it over traditional search (31%) (Source).
- AI-driven traffic converts at 14.2%, compared to 2.8% from Google search (Source).
- Bounce rates are 5.4% higher because users often land directly on conversion pages (Source).
- AI-based personalization improves conversions by 20-30% (Source).
So, AI is pushing web design toward faster, intent-driven experiences where users arrive ready to act. The biggest gains come from pairing AI traffic with strong UX and personalization, rather than relying solely on the traffic itself. Brands that optimize for clarity, relevance, and trust will benefit most from this shift.
Web Design Benchmarks by Industry
Web design performance varies by industry. B2B users research longer, B2C users convert faster, ecommerce struggles with cart abandonment, SaaS with onboarding drop-off, and trust-heavy sectors depend on visible security cues. Let’s look at some industry-specific data.
B2B vs B2C Web Design
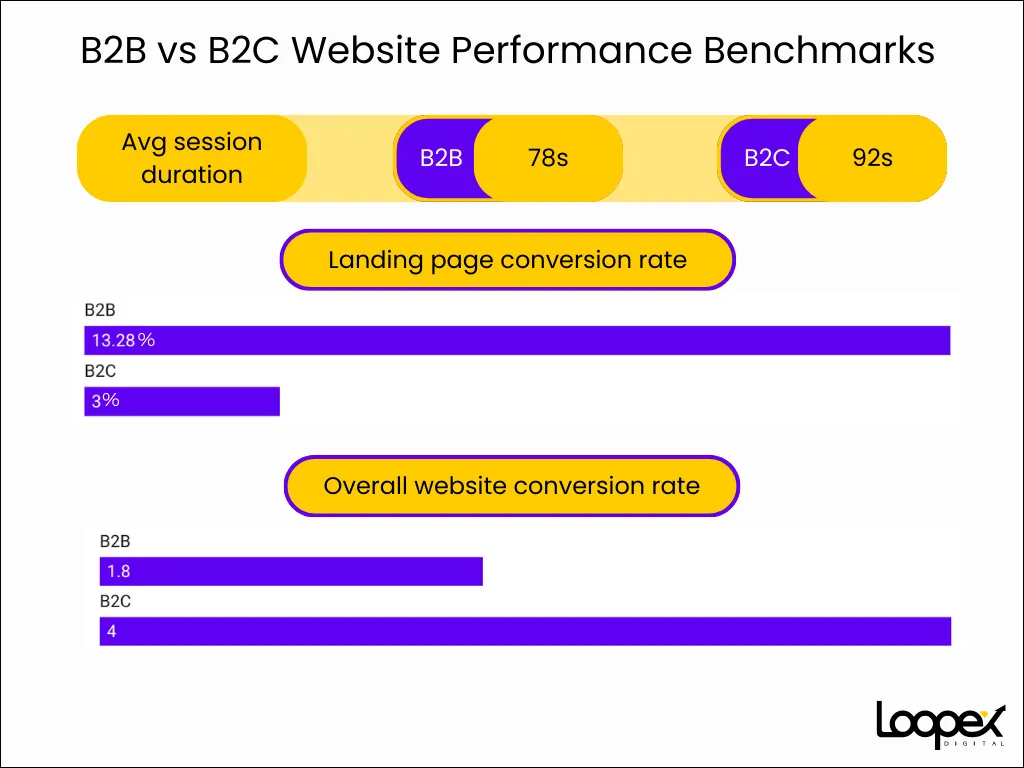
- B2B sites average 78 seconds per session. B2C ecommerce averages 92 seconds due to more exploratory browsing (Source).
- B2B landing pages convert at 13.28%, compared to 2-4% for B2C ecommerce (Source).
- Overall, B2B website conversion averages 1.8%, reflecting longer, multi-step decision paths (Source).
Takeaway: B2B users arrive with stronger intent but take more time to complete actions.
Ecommerce vs. SaaS Web Design
- Ecommerce cart abandonment averages 70.22%, reaching 85.65% on mobile (Source).
- SaaS onboarding sees 38% drop-off after the first screen. 70-80% of users leave before activating a trial or converting to a paid plan. (Source)
- Ecommerce focuses on fast checkout (2.8-4.2% conversion), while SaaS focuses on onboarding clarity and feature discovery. (Source)
Takeaway: Friction hurts ecommerce. Confusion hurts SaaS.
Trust-Heavy Industries (Finance, Healthcare)
Healthcare conversion rates average 2.8-4.2%. Other trust-heavy industries have similar rates, and to increase them, there are a few elements that web design statistics point to:
- Reviews near CTAs increase conversions by 34% (Source).
- Security badges increase conversions by 42%; EV SSL boosts conversions by 30%; 61% of users won’t purchase without visible trust seals (Source).
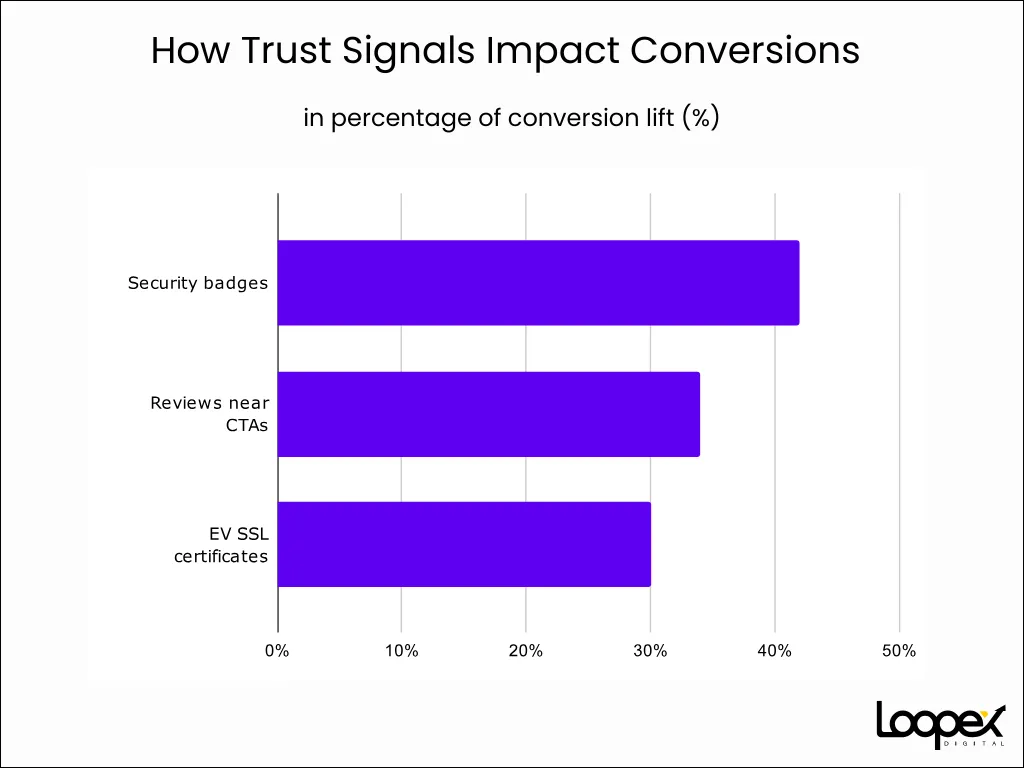
Takeaway: Trust signals directly reduce hesitation in regulated industries.
Research Methodology
This report is based on a structured review of recent web design and UX data from trusted industry sources:
- Data collection: We analyzed over 100 reputable websites, reports, and databases, focusing on the most recent web design statistics from 2025–2026. Priority was given to authoritative sources with consistent, verifiable data.
- Analysis: We reviewed trends across key areas, including mobile usage, AI integration, performance metrics, and industry spending. Figures were cross-checked across multiple sources to avoid outdated or conflicting data.
- Reporting: Findings are presented in a structured, scannable format. Key statistics are highlighted with concise explanations and supported by visuals where trends or comparisons add value.
- Updates: The data is reviewed regularly to reflect new benchmarks, platform changes, and industry shifts. Future updates incorporate fresh datasets and expert input to keep the insights current.
Conclusion
Web design in 2026 is no longer about aesthetics. The data keeps pointing to the same drivers: speed, mobile UX, accessibility, trust signals, and friction-free conversion paths. If you’re redesigning or optimizing this year, start with what moves behavior: reduce delays, simplify journeys, and make credibility obvious. We’ll keep updating this guide with fresh benchmarks every quarter, so you can make decisions based on current data, not assumptions.
References
- Grinning Graphics. Impactful Web Design and the 5-Second Rule. Accessed on January 19, 2026.
https://grinninggraphics.co.uk/impactful-web-design-5-second-rule/ - Taylor & Francis Online. The Role of Visual Appeal in Website Credibility (Behaviour & Information Technology Study). Accessed on January 19, 2026.
https://www.tandfonline.com/doi/abs/10.1080/01449290500330448 - Tenacity. How Website Design Influences 75% of Business Credibility. Accessed on January 19, 2026.
https://tenacity.io/facts/how-website-design-influences-75-of-your-business-credibility/ - MindInventory. UI/UX Design Statistics You Should Know. Accessed on January 19, 2026.
https://www.mindinventory.com/blog/ui-ux-design-statistics/ - Loopex Digital. SEO Statistics You Should Know. Accessed on January 19, 2026.
http://loopexdigital.com/blog/seo-statistics - DataIntelo. Global Web Developer Services Market Report. Accessed on January 19, 2026.
https://dataintelo.com/report/global-web-developer-services-market - LinkedIn Pulse. Global Web Design Services Market Forecast 2025–2032. Accessed on January 19, 2026.
https://www.linkedin.com/pulse/global-web-design-services-market-forecast-2025-2032-component-sanec/ - Fortune Business Insights. UX Services Market Size, Share, and Forecast. Accessed on January 19, 2026.
https://www.fortunebusinessinsights.com/ux-services-market-108780 - Research and Markets. Full-Cycle Web Development Service Market Report. Accessed on January 19, 2026.
https://www.researchandmarkets.com/reports/6140956/full-cycle-web-development-service-market - Business Research Insights. User Interface (UI) Design Market Report. Accessed on January 19, 2026.
https://www.businessresearchinsights.com/market-reports/user-interface-ui-design-market-102500 - Mordor Intelligence. UI/UX Market – Industry Analysis. Accessed on January 19, 2026.
https://www.mordorintelligence.com/industry-reports/ui-ux-market - Zeal. The Importance of Mobile-First Design in 2025. Accessed on January 19, 2026.
https://wehavezeal.com/insights/the-importance-of-mobile-first-design-in-2025/ - Hostinger. How Many Websites Are There in the World? Accessed on January 19, 2026.
https://www.hostinger.com/au/tutorials/how-many-websites-are-there/ - Oddball Marketing. How Many New Websites Are Created Daily? Accessed on January 19, 2026.
http://oddballmarketing.com.au/blog/how-many-new-websites-are-created-daily/ - Toptal. UX Statistics and Insights Infographic. Accessed on January 19, 2026.
https://www.toptal.com/designers/ux/ux-statistics-insights-infographic - Emplifi. US & UK Customer Expectations Report. Accessed on January 19, 2026.
https://go.emplifi.io/us-uk-customer-expectations-report.html - Arounda Agency. UX Statistics and Trends. Accessed on January 19, 2026.
https://arounda.agency/blog/ux-statistics - VWO. Website Traffic Statistics You Should Know. Accessed on January 19, 2026.
https://vwo.com/blog/website-traffic-statistics/ - Flowlu. Ecommerce Statistics and Productivity Insights. Accessed on January 19, 2026.
https://www.flowlu.com/blog/productivity/ecommerce-statistics/ - AllAccessible. Web Accessibility Statistics: Impact of Disabilities on Web Use. Accessed on January 19, 2026.
https://www.allaccessible.org/sv/blog/web-accessibility-statistics-the-impact-of-disabilities-on-web-use - Tenet. Web Accessibility Statistics and Insights. Accessed on January 19, 2026.
https://www.wearetenet.com/blog/web-accessibility-statistics - Elfsight. Website Accessibility Statistics. Accessed on January 19, 2026.
https://elfsight.com/blog/website-accessibility-statistics/ - EcomBack. 2025 Mid-Year ADA Website Lawsuit Report. Accessed on January 19, 2026.
https://www.ecomback.com/ada-website-lawsuits-recap-report/2025-mid-year-ada-website-lawsuit-report - DarrowEverett. ADA Website Accessibility Litigation Insights. Accessed on January 19, 2026.
https://darroweverett.com/ada-website-accessibility-litigation-insights-legal-analysis/ - Recite Me. Web Accessibility Statistics and Trends. Accessed on January 19, 2026.
https://reciteme.com/us/news/web-accessibility-statistics-and-trends/ - Baymard Institute. Mobile UX for Ecommerce: Usability Insights. Accessed on January 19, 2026.
https://baymard.com/blog/mobile-ux-ecommerce - Venn Apps. Essential Mobile Commerce Statistics for 2025. Accessed on January 19, 2026.
https://www.vennapps.com/blog/35-essential-stats-on-mobile-commerce-in-2025 - LinkedIn Pulse. Essential UX Statistics for 2025. Accessed on January 19, 2026.
https://www.linkedin.com/pulse/essential-ux-statistics-2025-webeyez-ftkyf/ - Phone Simulator. Mobile Navigation Patterns in 2026. Accessed on January 19, 2026.
https://phone-simulator.com/blog/mobile-navigation-patterns-in-2026 - LinkedIn. Tap Targets and Thumb Zones in Mobile UX. Accessed on January 19, 2026.
https://www.linkedin.com/posts/aditi-padshala-18b955289_tap-targets-and-thumb-zones-the-overlooked-activity-7358158991400591360-mI1x/ - Ecommerce Bonsai. UX Statistics for Ecommerce. Accessed on January 19, 2026.
https://ecommercebonsai.com/ux-statistics/ - Google Developers. Core Web Vitals Documentation. Accessed on January 19, 2026.
https://developers.google.com/search/docs/appearance/core-web-vitals - Ateam Soft Solutions. Core Web Vitals Optimization Guide (2025). Accessed on January 19, 2026.
https://www.ateamsoftsolutions.com/core-web-vitals-optimization-guide-2025-showing-lcp-inp-cls-metrics-and-performance-improvement-strategies-for-web-applications/ - QuickTop10. Impact of Website Speed on Bounce Rate. Accessed on January 19, 2026.
https://quicktop10.com/blog/impact-of-website-speed-on-bounce-rate/ - Marketing LTB. Website Speed Statistics. Accessed on January 19, 2026.
https://marketingltb.com/blog/statistics/website-speed-statistics/ - Marketing LTB. Mobile Ecommerce Statistics. Accessed on January 19, 2026.
https://marketingltb.com/blog/statistics/mobile-ecommerce-statistics/ - Contentsquare. Cart Abandonment Statistics. Accessed on January 19, 2026.
https://contentsquare.com/guides/cart-abandonment/stats/ - Cropink. Shopping Cart Abandonment Statistics. Accessed on January 19, 2026.
https://cropink.com/cart-abandonment-statistics - ClickPost. Cart Abandonment Statistics Explained. Accessed on January 19, 2026.
https://www.clickpost.ai/blog/cart-abandonment-statistics - Retail Dive. How to Reduce Shopping Cart Abandonment on Mobile. Accessed on January 19, 2026.
https://www.retaildive.com/ex/mobilecommercedaily/7-ways-to-reduce-shopping-cart-abandonment-on-mobile - WiserNotify. Call-to-Action Statistics. Accessed on January 19, 2026.
https://wisernotify.com/blog/call-to-action-stats/ - Sender. Call-to-Action Statistics and Benchmarks. Accessed on January 19, 2026.
https://www.sender.net/blog/call-to-action-statistics/ - Edge Digital. Optimising Conversion Rates. Accessed on January 19, 2026.
https://www.edgedigital.net/optimising-conversion-rates/ - Searchbloom. CRO Case Study: Self Reliance Outfitters. Accessed on January 19, 2026.
https://www.searchbloom.com/case-studies/cro/self-reliance-outfitters-case-study/ - Trajectory Web Design. B2B Website Trust Signals. Accessed on January 19, 2026.
https://www.trajectorywebdesign.com/blog/b2b-website-trust-signals - Accenture. Widening Gap Between Consumer Expectations and Reality. Accessed on January 19, 2026.
https://newsroom.accenture.com/news/2018/widening-gap-between-consumer-expectations-and-reality-in-personalization-signals-warning-for-brands-accenture-interactive-research-finds - Amra & Elma. High-Converting CTA Statistics. Accessed on January 19, 2026.
https://www.amraandelma.com/high-converting-cta-statistics/ - Genesys Growth. Landing Page Conversion Statistics for Marketing Leaders. Accessed on January 19, 2026.
https://genesysgrowth.com/blog/landing-page-conversion-stats-for-marketing-leaders - FounderJar. UX Statistics and Trends. Accessed on January 19, 2026.
https://www.founderjar.com/ux-statistics/ - New Media. Web Design Statistics. Accessed on January 19, 2026.
https://newmedia.com/blog/web-design-statistics - Elementor. Web Design Trends for 2026. Accessed on January 19, 2026.
https://elementor.com/blog/web-design-trends-2026/ - Rocking Web. Web Design Statistics. Accessed on January 19, 2026.
https://www.rockingweb.com.au/web-design-statistics/ - Marketing LTB. Website Design Statistics. Accessed on January 19, 2026.
https://marketingltb.com/blog/statistics/website-design-statistics/ - FullStack Industries. The Future of Website Design in 2025. Accessed on January 19, 2026.
https://www.fullstackindustries.com/insights/the-future-of-website-design-2025/ - Web Moghuls. AI-Powered UI Design Trends for 2026. Accessed on January 19, 2026.
https://www.webmoghuls.com/7-ai-powered-ui-design-trends-2026/ - Ginger IT Solutions. Web Design Trends for 2026. Accessed on January 19, 2026.
https://www.gingeritsolutions.com/blog/web-design-trends-2026/ - McKinsey & Company. The New Front Door to the Internet: Winning in the Age of AI Search. Accessed on January 19, 2026.
https://www.mckinsey.com/capabilities/growth-marketing-and-sales/our-insights/new-front-door-to-the-internet-winning-in-the-age-of-ai-search - Exposure Ninja. AI Search Statistics and Trends. Accessed on January 19, 2026.
https://exposureninja.com/blog/ai-search-statistics/ - WiserReview. Personalization Statistics. Accessed on January 19, 2026.
https://wiserreview.com/blog/personalization-statistics/ - OpenSend. Average Session Duration in Ecommerce. Accessed on January 19, 2026.
https://www.opensend.com/post/average-session-duration-ecommerce - Keywords Everywhere. Landing Page Statistics. Accessed on January 19, 2026.
https://keywordseverywhere.com/blog/landing-page-stats/ - Martal Group. Conversion Rate Statistics. Accessed on January 19, 2026.
https://martal.ca/conversion-rate-statistics-lb/ - Userpilot. UX Statistics and Benchmarks. Accessed on January 19, 2026.
https://userpilot.com/blog/ux-statistics/ - Amra & Elma. Funnel Drop-Off Rate Statistics. Accessed on January 19, 2026.
https://www.amraandelma.com/funnel-drop-off-rate-statistics/ - Roast My Web. Average Website Conversion Rate by Industry. Accessed on January 19, 2026.
https://www.roastmyweb.com/blog/average-website-conversion-rate-by-industry - Rocking Web. Conversion Rate Statistics by Industry. Accessed on January 19, 2026.
https://www.rockingweb.com.au/conversion-rate-statistics-by-industry/ - Marketing LTB. Web Development Statistics. Accessed on January 19, 2026.
https://marketingltb.com/blog/statistics/web-development-statistics/
Maria Harutyunyan is the Co-founder and Head of SEO at Loopex Digital, where she leads SEO strategy for SaaS, e-commerce, and B2B brands. With 10+ years in search, she specializes in link building and digital PR, earning editorial backlinks from MSN, Business Insider, Android Authority, and 30+ other major publications. She has been featured in Forbes, quoted as an SEO expert on Shopify, and writes for Convince & Convert, SE Ranking, and Mangools (KWFinder). She is also the founder of Armenia's first SEO Academy, having trained 500+ marketers.
Submit the form - Get Free Proposal
24 hours
Don’t forget to share this post!
Latest Articles


Submit the form - Get Free Proposal
24 hours

